I’ve been pondering a question lately: What happened to all the buyers?1
Sales in March were down about 13 per cent year-over-year, and month-to-date, things aren’t looking too pretty for the April numbers unless things really pick up in this last stretch of the month.
And while we could easily chalk this up to all the “tariff uncertainty” out there and call it a day, if you’ve been following this blog for a while, you’ll know I’m a bit skeptical of that argument.
I’m not saying this whole tariff fiasco has nothing to do with the market activity we’re seeing right now (or, lack thereof), but I remain skeptical that this particular form of uncertainty explains everything.
Building a mystery
Digging deeper, I thought it’d be interesting to identify the groups of people most likely to be on the fence about participating in the market as a result of the uncertainty out there.
If you think about who buys homes, at the broadest level, they can be categorized into two buckets: first-time home buyers (FTHBs) and repeat buyers.
Looking at the market through this lens, it seems reasonable to think that the group of folks who’d most likely be hesitant to enter the market given all the uncertainty would be FTHBs.
Statistically speaking, these folks are typically younger, have less savings, and are often less senior in their careers and therefore usually have less job security.
It’s hard to blame anyone looking to buy their first home for being hesitant at the moment – it’s a big commitment, and many FTHBs don’t have a lot of financial cushion to rely on, should things get turbulent.
So, it’s easy to see why some FTHBs might just wait things out.
Not like the other
By contrast, repeat buyers represent an interesting counterpoint.
Many would have built up equity through paying down their mortgage over the years, providing some financial cushion, and some may not even have a mortgage at all, owning their homes outright2.
These buyers are also typically older than FTHBs, and by virtue of their seniority, they may also enjoy a bit more job security having been employed in the labor market longer.
They’re also “in the market” already by definition, so the ups and downs of the market are slightly less of a concern to them, since they can always wait things out fairly comfortably in their current home.
But it’s exactly this aspect of this whole puzzle I find interesting, and it’s a thread I want to pull on.
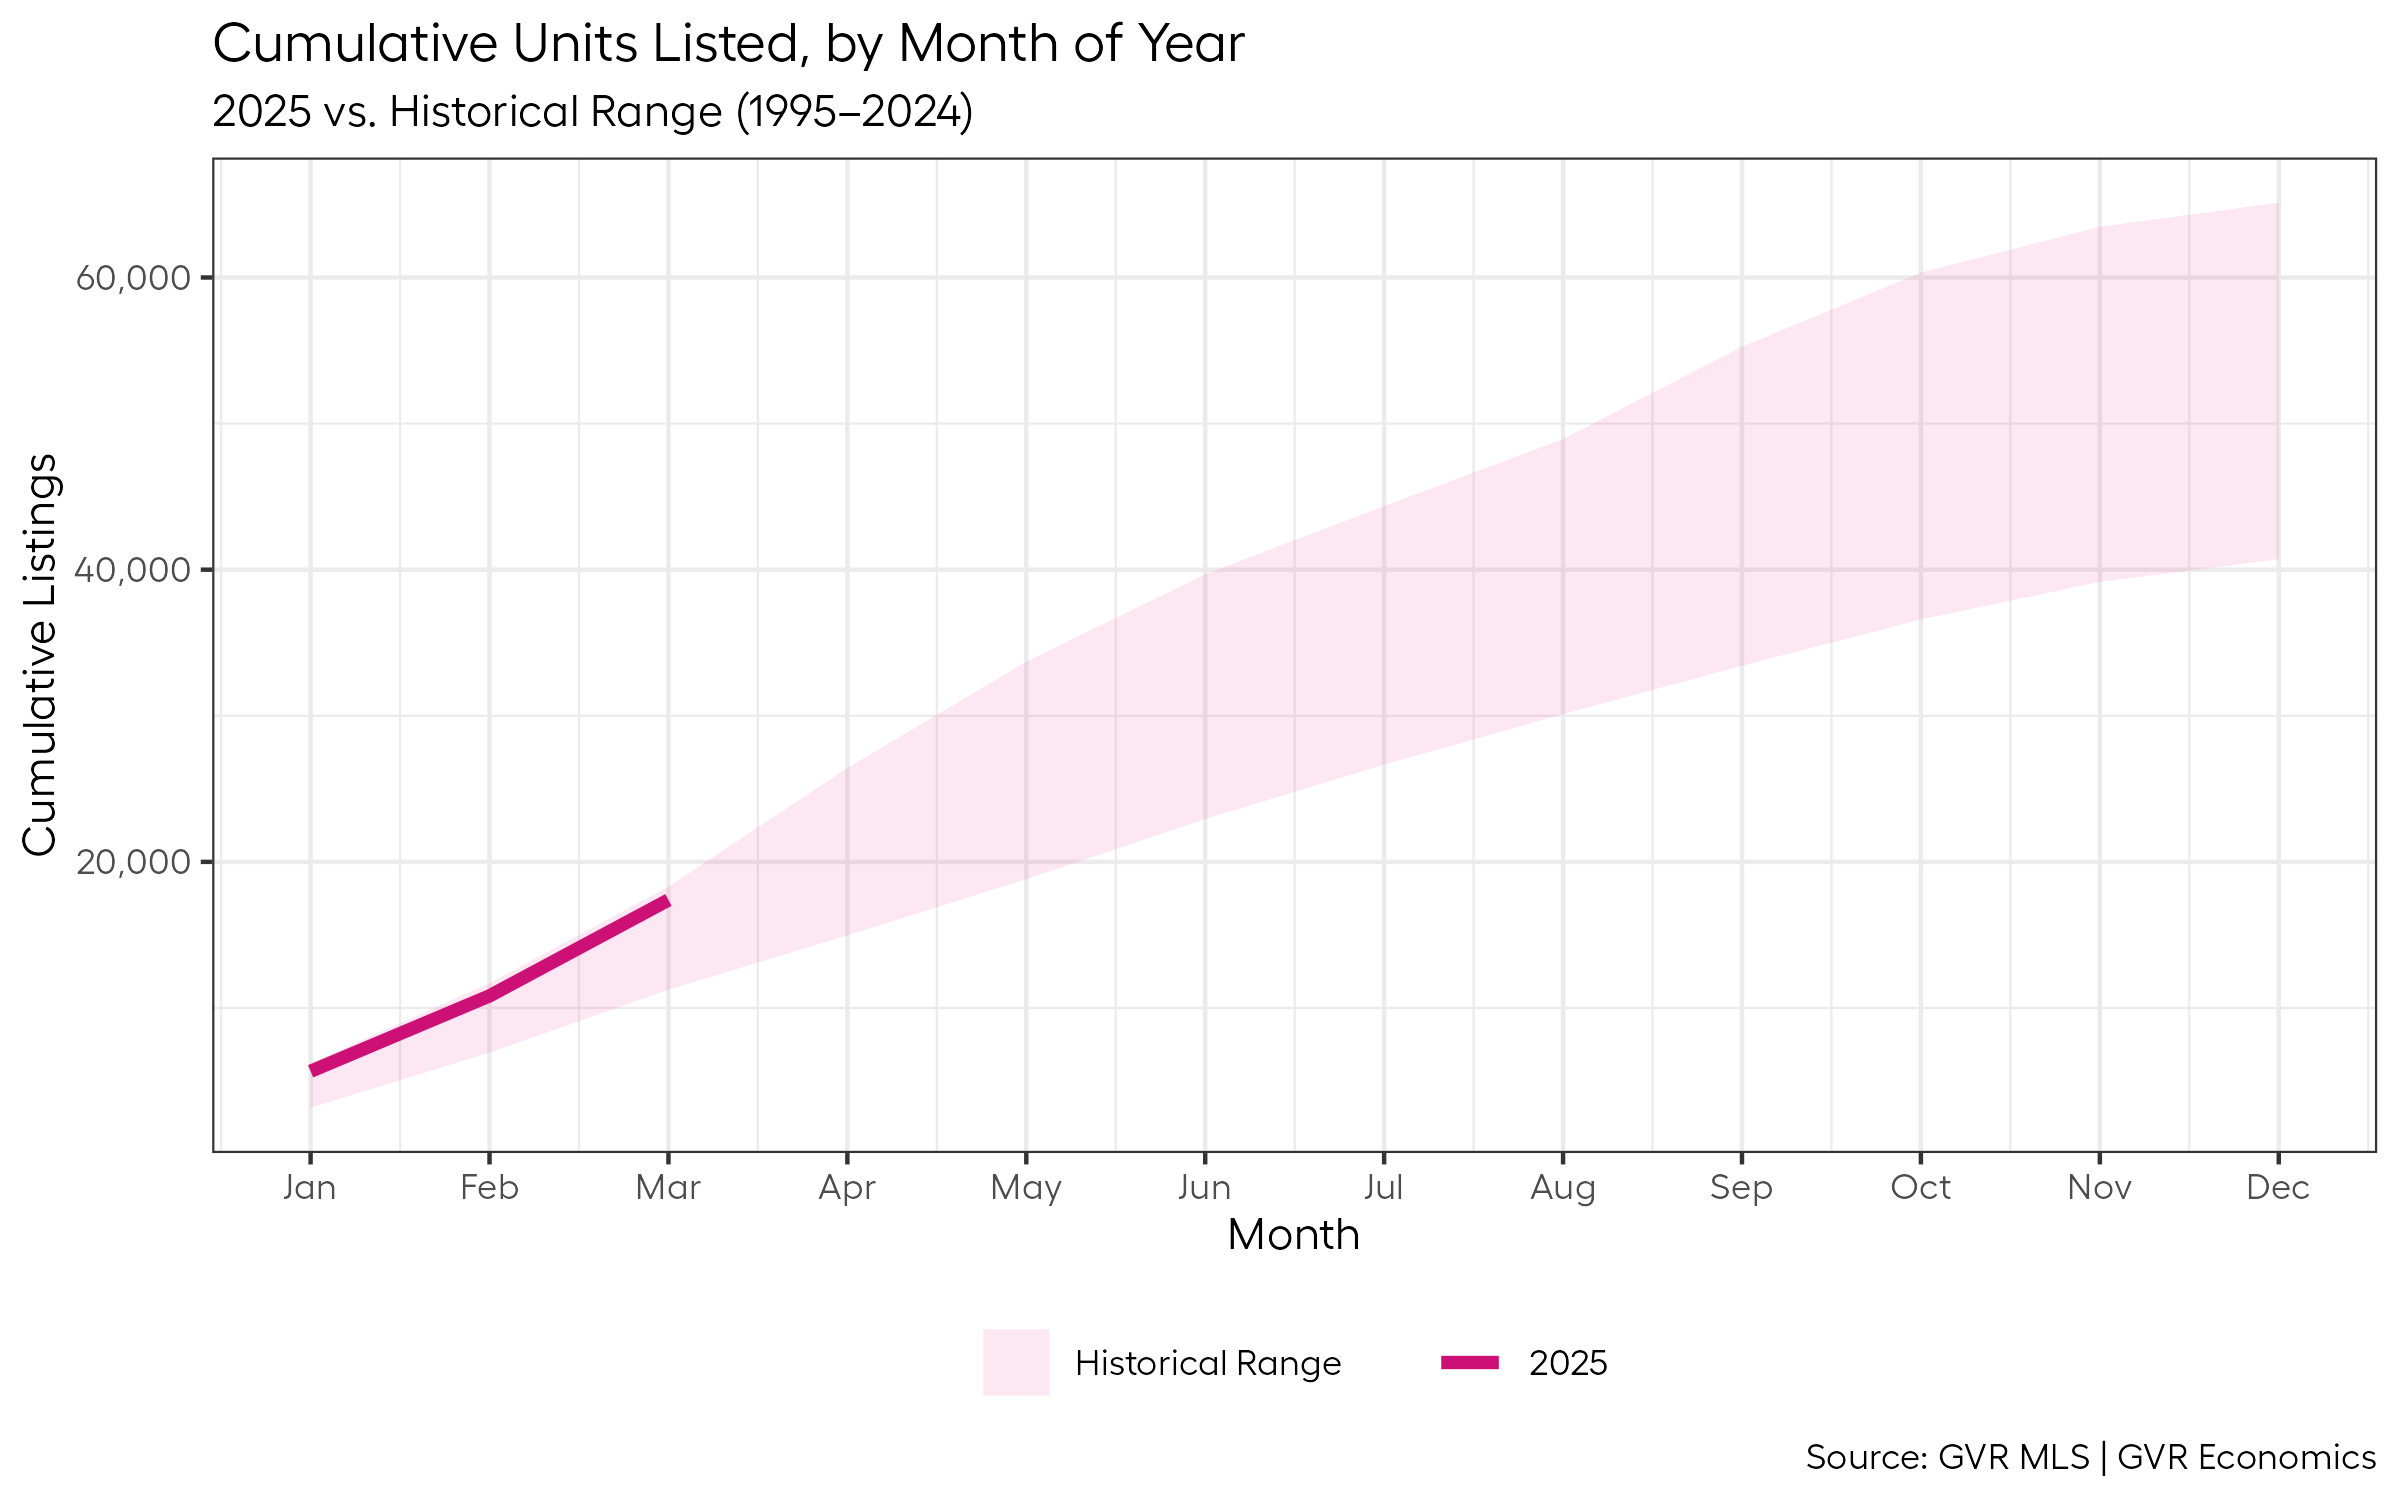
We actually are seeing an increase of new listings coming to the market, which suggests many repeat buyers are willing to engage in the market – if only they could find a buyer for the home they want to sell!
To check this, we can see that the cumulative count of new listings year-to-date is currently riding the very top of the historical range, which means there’s no shortage of willing sellers.
So, I’m not sure we can really pin the blame for the lack of sales on the repeat buyer segment, particularly if a seller from this segment is also a buyer themselves.
It’s probably this group of market participants that we can thank for having any sales at all!
Blame the youth?
Hypothetically then, if we were to try and blame the lackluster sales entirely on FTHBs sitting it out, it’d have to be the case that they make up a large enough portion of buyers to have such a large impact on the sales figures.
As it turns out, we can (sort of) evaluate this quantitatively thanks to some (slightly dated) numbers from Statistics Canada that gives us a sense of the proportion of buyers that are FTHBs, versus repeat buyers.
Here’s a plot of the data for the Vancouver CMA to 20213, but the numbers are pretty similar for BC overall as well.
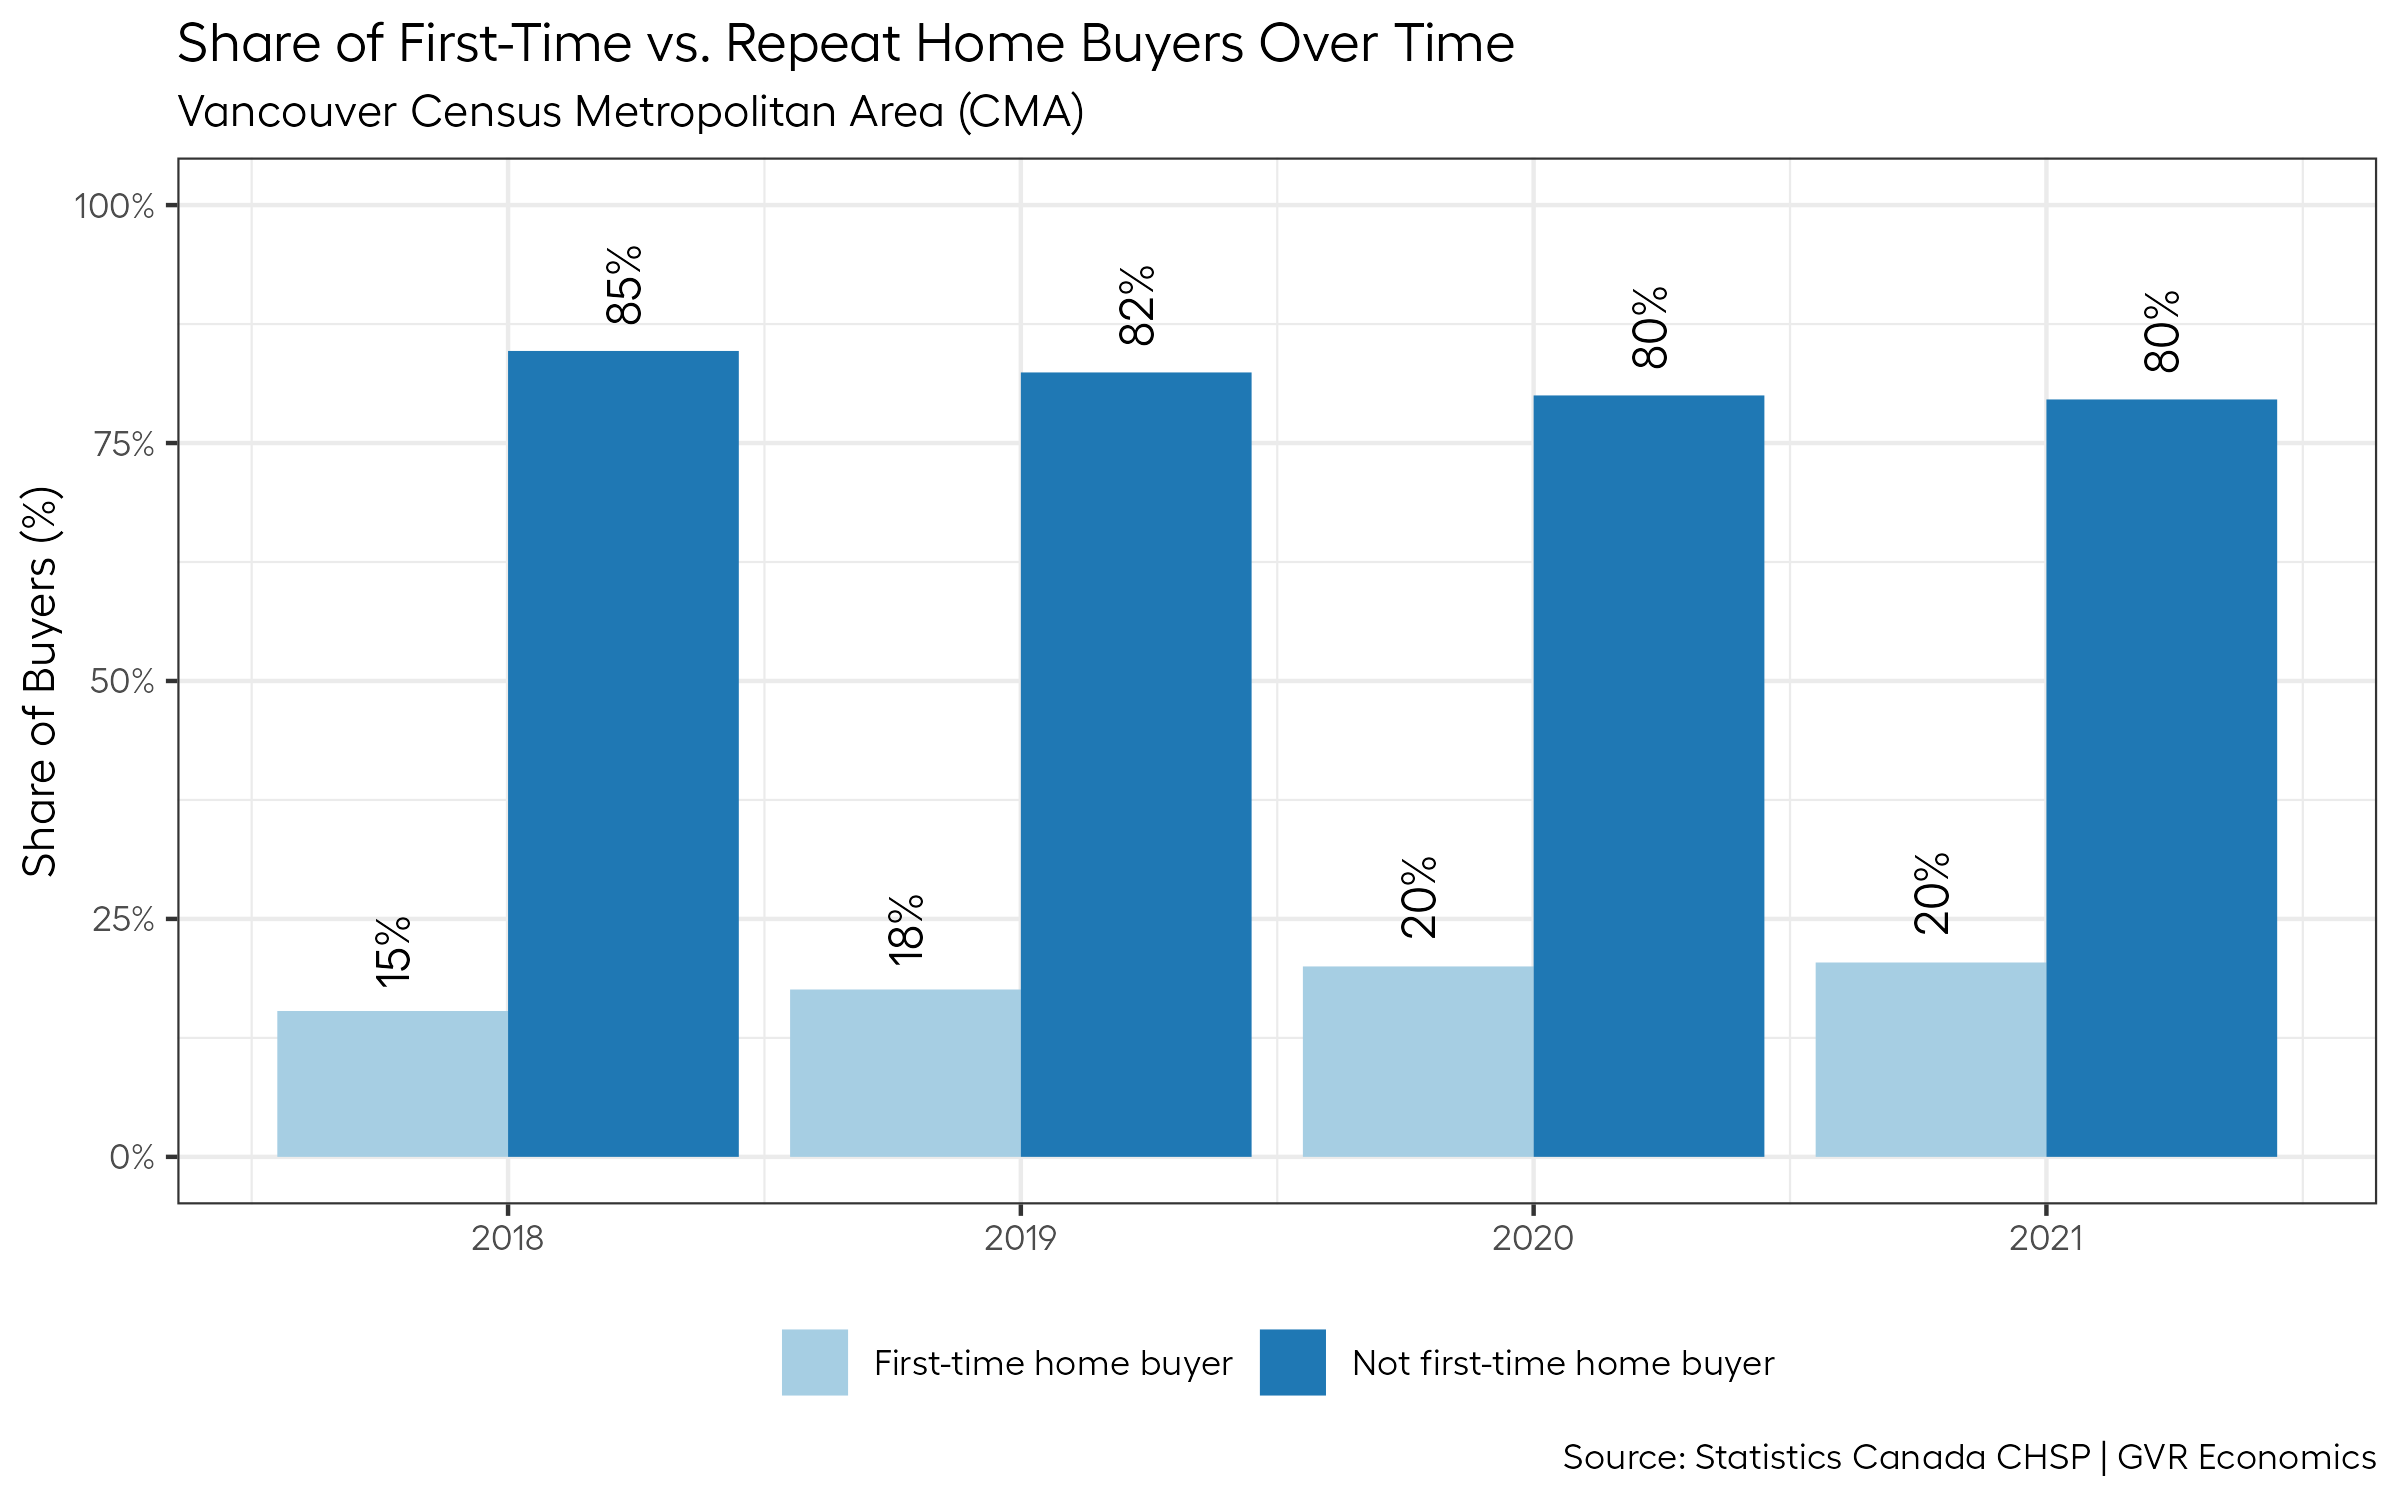
As we can see, in the most recently available data, roughly 20 per cent of people who purchased homes in the Vancouver CMA in 2021 were FTHBs, and it’s likely that if these figures were available for 2025, the number wouldn’t be too far off 20 per cent.
Enevelope math
So, knowing this information, it’s a straightforward calculation to figure out if it’s even possible that FTHBs could be entirely to blame for the lack of sales.
Given that we know roughly 20 per cent of buyers are FTHBs (on average), if sales typically average around 3,330 for the month of March (based on the 10-year seasonal average), then a full 20 per cent of these sales missing would leave us with about 2,640 sales.
But March sales were only 2,091, which is 549 sales fewer.
And it’s not very likely that all FTHBs have been sitting on the sidelines. Surely, some of them must be participating in the market?
So, where are all the buyers that would explain the remaining (hypothetical) gap?
Scared money
If it’s not entirely FTHBs, and if it’s not sellers who are also looking to buy, it seems that one of the only segments of market participants left to blame for the lack of sales are investors, who represent a subset of the repeat buyer segment.
Unlike FTHBs, who by definition can only be buyers, investors can be both buyers and sellers of property.
And unlike owner-occupant repeat buyers, investors may be repeat buyers who don’t occupy the dwelling which they own as an investment property.
This means investors can be net-sellers of property, not needing to buy another home to live in themselves, which could help explain the high levels of new listings we are seeing.
The question that remains is whether there are enough investors in the market to explain the remaining (hypothetical) gap in sales?
Boiling frogs
Again, thanks to the Canadian Housing Statistics Program data, we can try to quantify whether it’s even numerically possible investors could comprise a large enough share of the market to impact sales to such a degree.
In BC, we know that roughly 25 per cent of all properties were owned by investors, as of the latest data in 2022.
On its face, 25 per cent is a large enough share of owners to swing sales one way or the other based on their inclination to participate in the market at any given point in time.
After all, we just saw what the theoretical impact of 20 per cent of FTHBs evaporating from the market could potentially do to sales based on some back-of-the-envelope math.
But we can do one better in analyzing this, and we can also examine the proportion of investor-owned properties broken out by property type, which can add some fidelity to the discussion.
Here’s a plot of that:
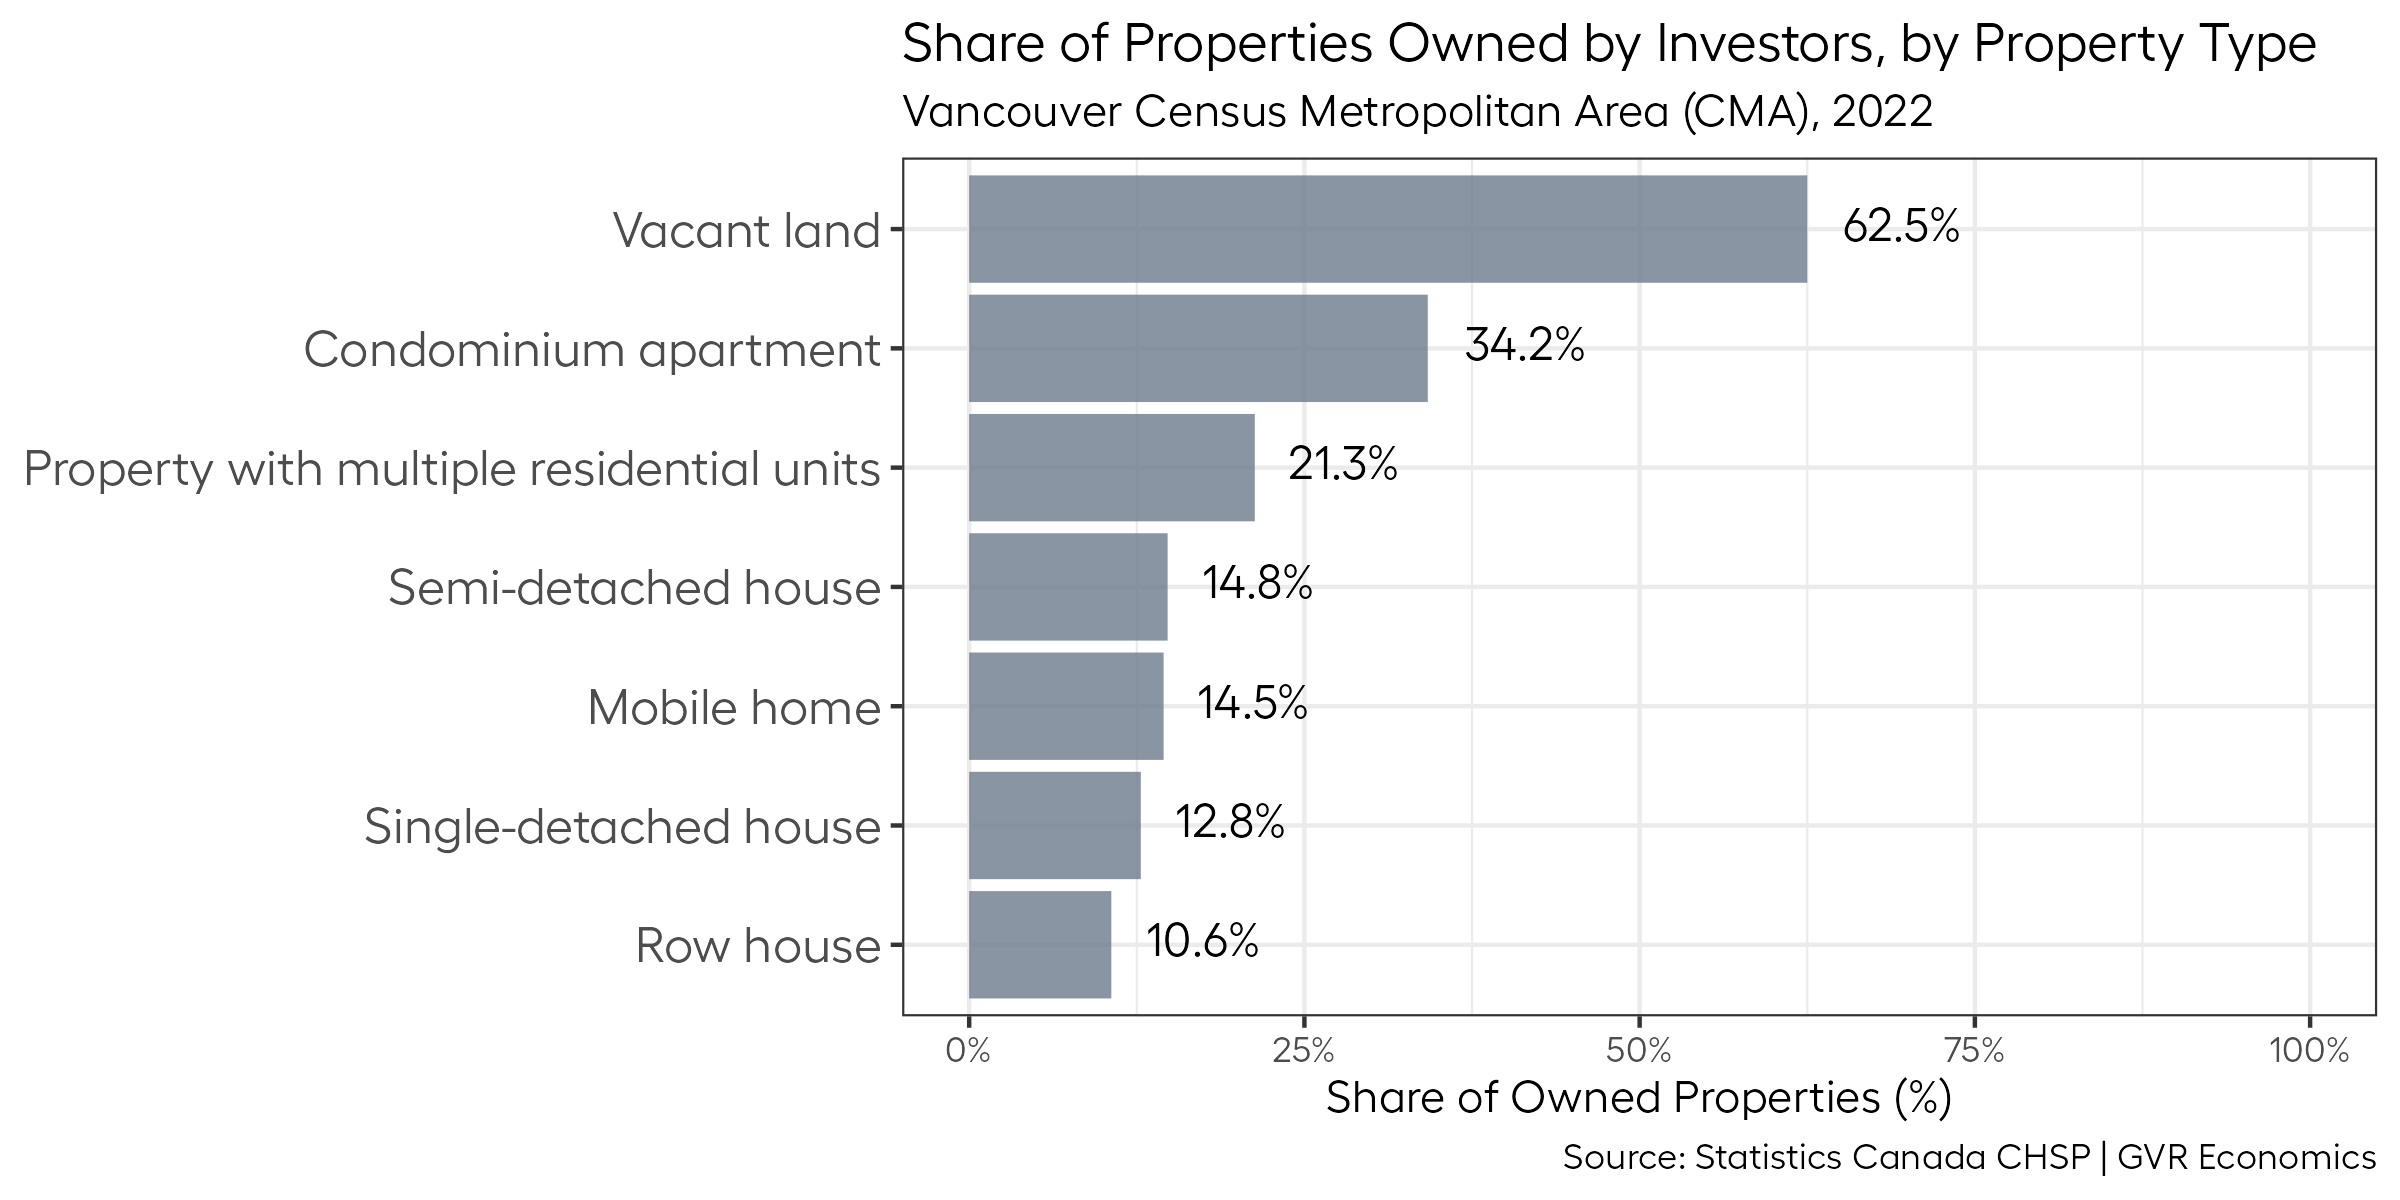
Topping the list is vacant land, which makes up a very small share of MLS® transactions, usually just a few per cent.
So, even if all the investors owning vacant land were to exit the market on the buy side, the impact would be fairly trivial to monthly sales figures at the aggregate level.
Working our way down the list, condominium apartments are next in line, which increasingly make up a larger share of all sales in our MLS® data, standing a little over 50 per cent of sales as of the most recent data.
 Given that the price point for apartments is typically lower than detached or attached properties, this segment of the market would be considered the most liquid from a financial standpoint, and so it’s probably in this segment where we’d first see any signs of trouble.
And with about 34 per cent of all condominiums in the Vancouver CMA owned by investors, it’s quite plausible that a major chill in investor sentiment could make a decent dent in the aggregate sales statistics, if many investors suddenly became net-sellers, not looking to enter on the buy side.
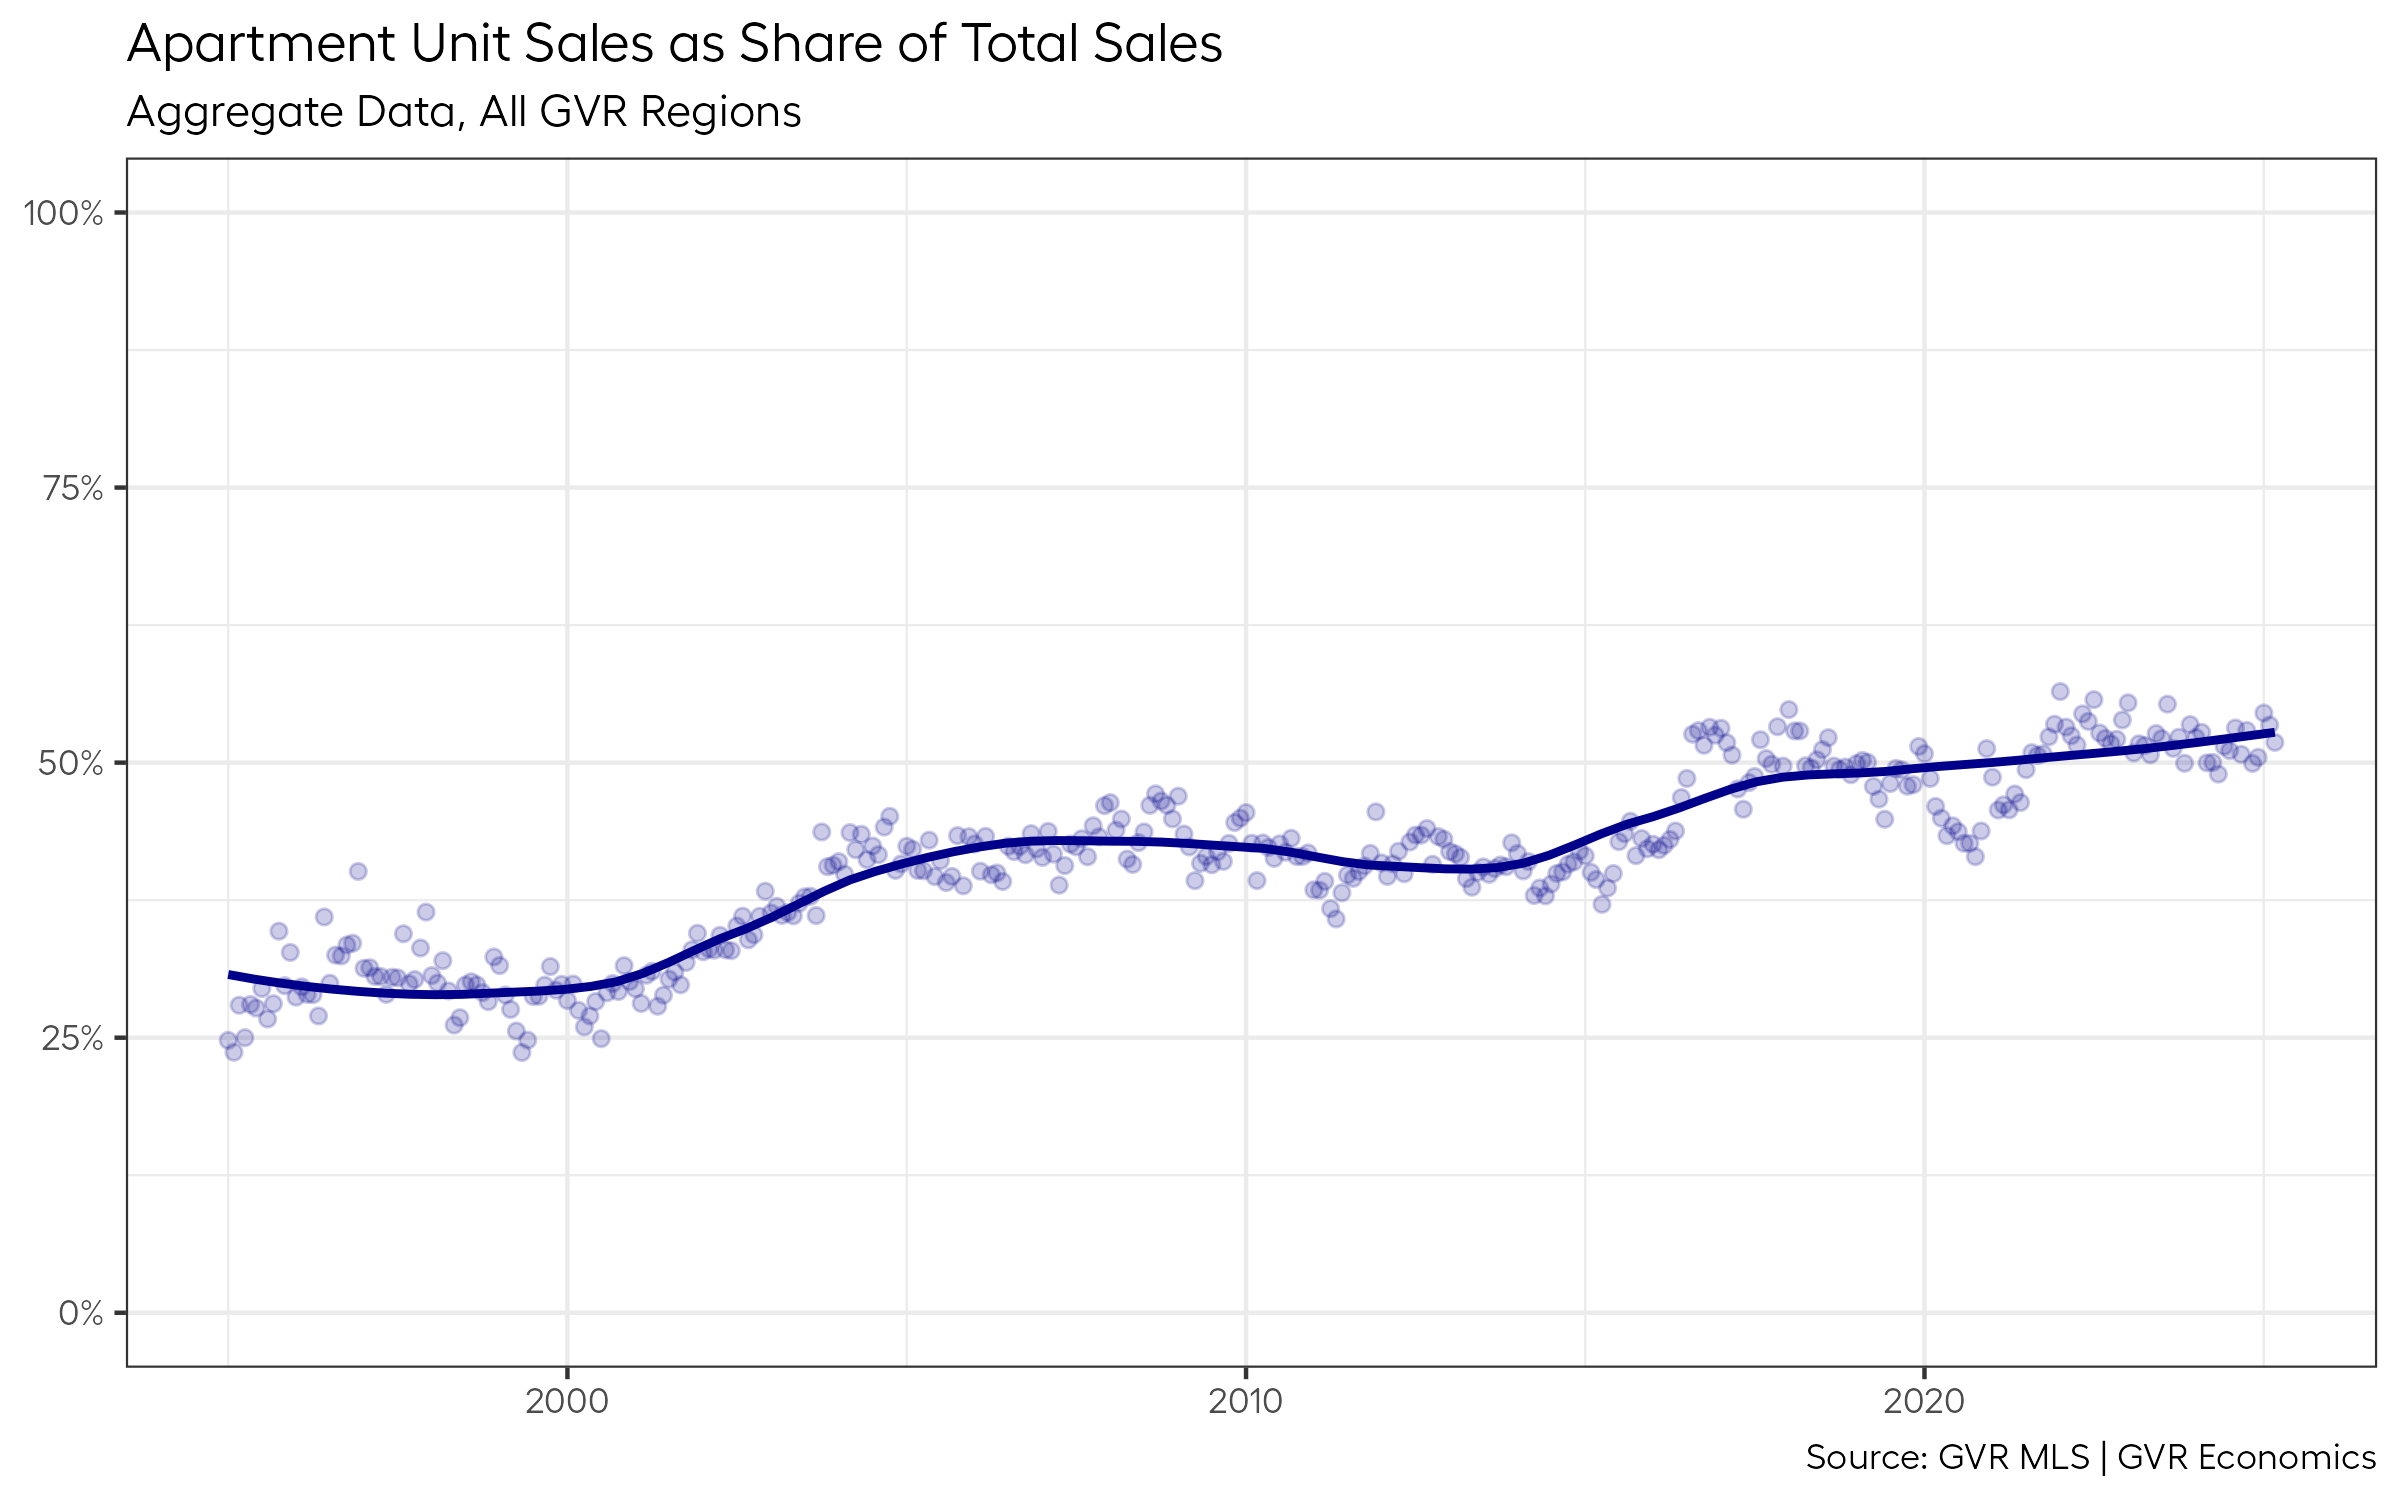
Turning to the new listings data, we can check whether there’s been a disproportionate increase in the number of sellers of apartment units vis-a-vis other property types fairly easily.
Here’s a plot of that:
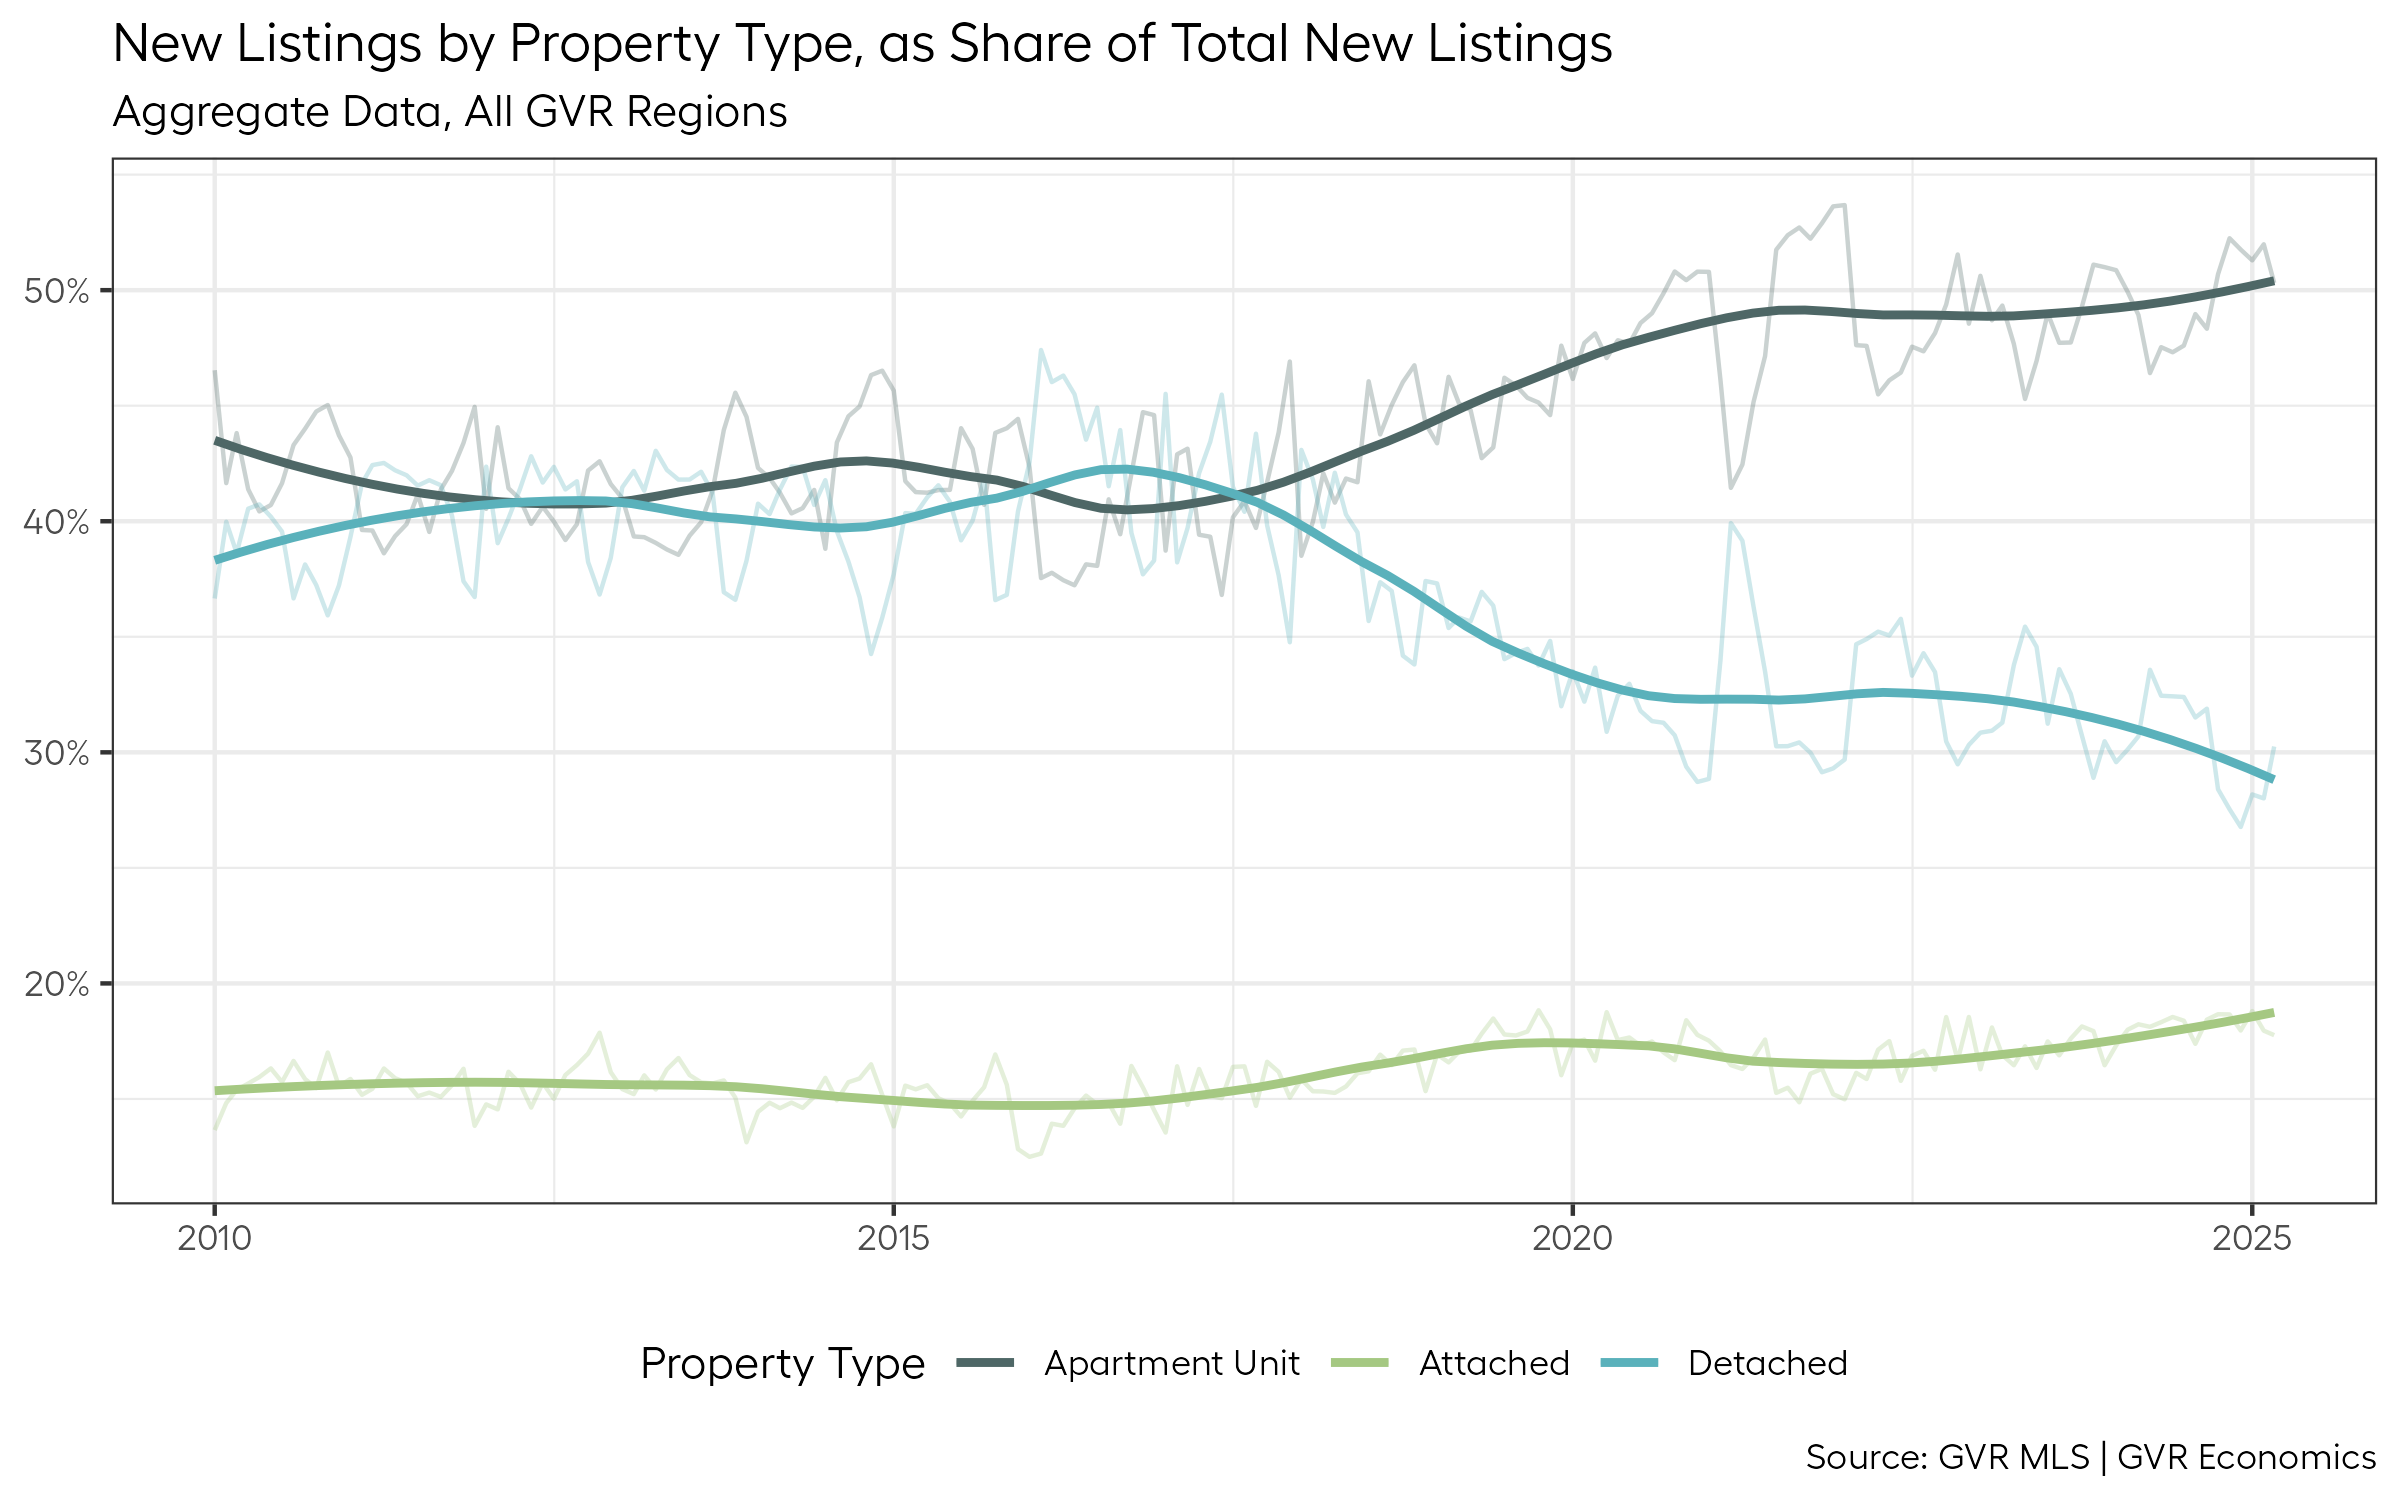
While it’s clear that apartment units have increasingly made up a larger share of all newly listed properties over the last 15 years or so, what’s striking about this plot is that this is not a an extremely recent phenomenon.
We can see a sizable divergence in the listing data starting as far back as 2018, which as many may recall, was when the ratchet of provincial policy targeting the housing market in BC really started ratcheting up, with the “30-Point Plan for Housing Affordability”.
But what the data do not show, is a very large and sudden surge in apartment listings relative to other property types over the past few months, ever since this tariff nonsense started playing out.
If these data are any evidence of pressure on investors, it looks more like a boiling frog than a sudden punch in the gut.
So, what should we make of all this?
Get out of the pool
As I said off the top, I remain skeptical that the tariff uncertainty is to blame entirely for the lack of sales.
When I consider the data just presented, in addition to the fact that presently, there are few (if any) tangibly visible impacts from the tariffs in the macroeconomic data for BC such as rapidly rising unemployment, or a significant slowdown in the economy, I’m left increasingly unconvinced that the “tariff tantrum” is the primary culprit.
I’ll cede the point that this tariff-related uncertainty is very likely keeping some participants out of the market on the buy-side, and given the slowdown in sales is fairly synchronized across Canada4, it’s probable there’s some related zeitgeist souring the mood of home buyers across the country.
But it’s also hard to ignore the compounding effects of all the recent major domestic housing-related policy shifts, which I think are starting to become increasingly visible in the market.
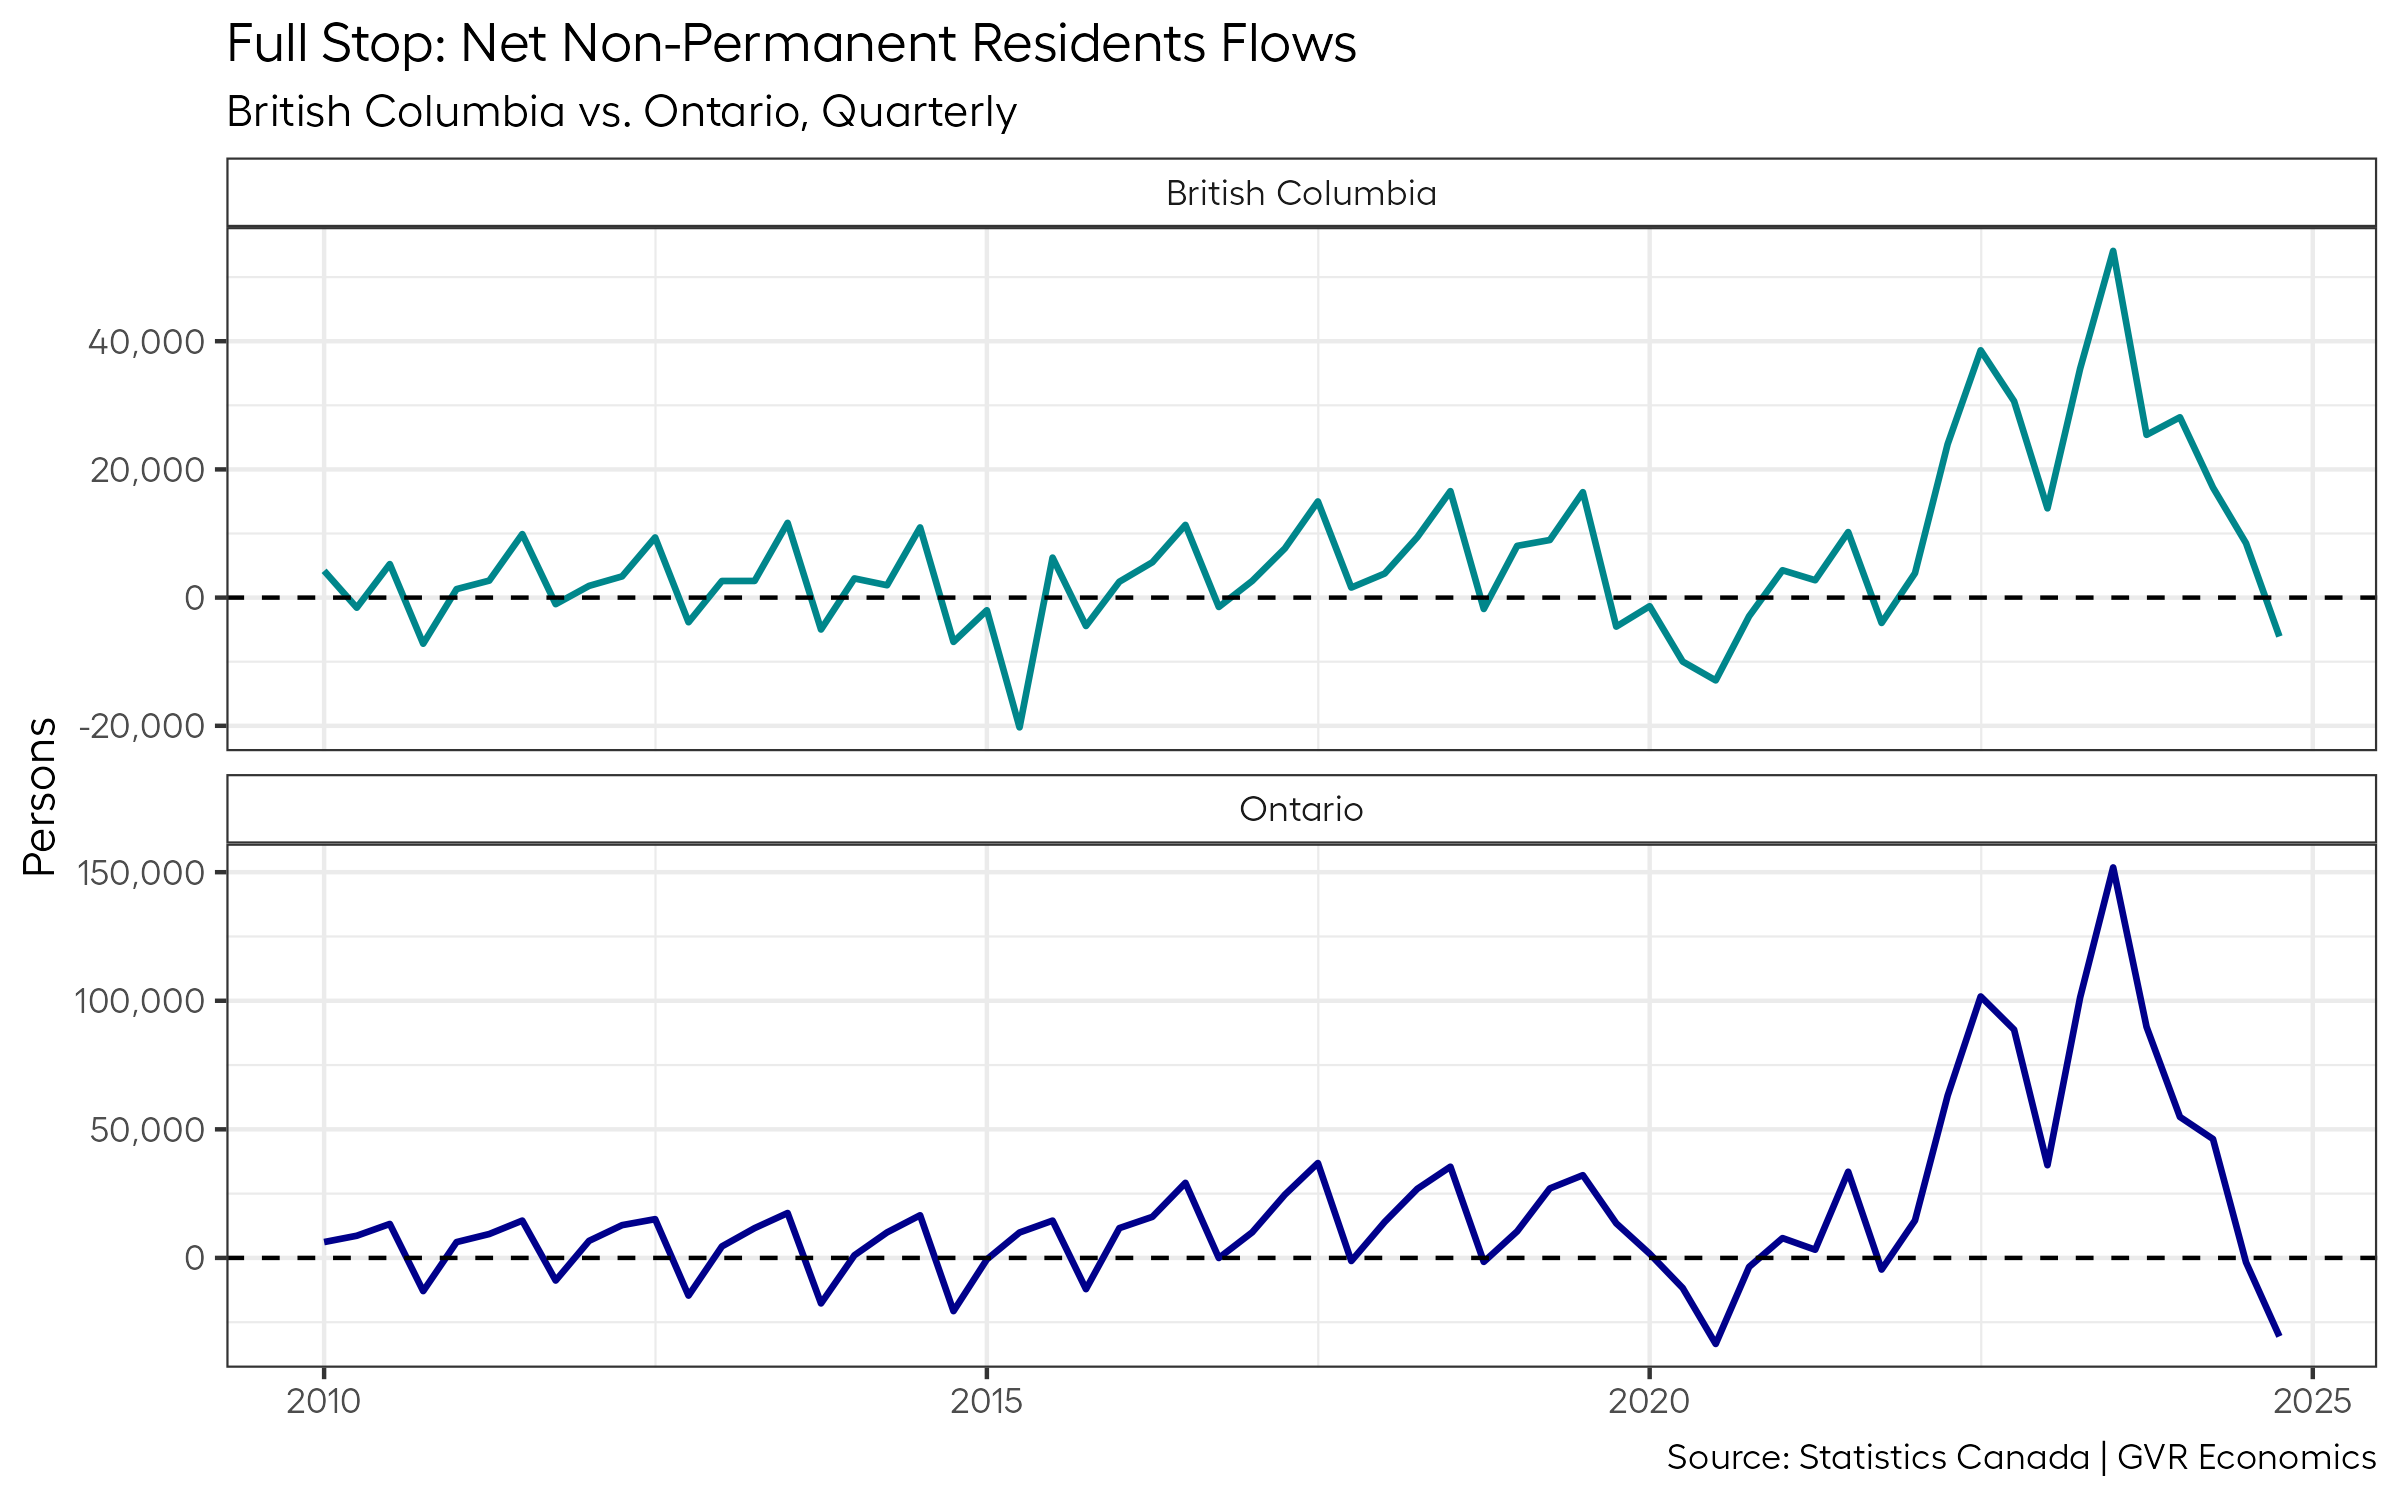
If I had to bet money on it5, I’d wager that one of the most impactful policies of late that could explain what we are seeing is related to the reduced speed limit being imposed by the federal government on immigration.
That’s the kind of policy that could have investors spooked about the possibility of higher vacancy, and perhaps, declining rents in the near future.
It’s the kind of policy that could quite easily have a lot investors getting out of the pool, or never setting foot in it to begin with.
And it’s also a policy impacting all of Canada that recently took effect, which would help explain the synchronicity in the slowdown of sales across the country since then, particularly in regions where investors comprise the majority of rental housing supply, such as in BC and Ontario.
Pair this with the increasingly inhospitable climate towards landlords in BC courtesy of provincial government policy, along with the new “flipping tax” (also courtesy of the provincial government), as well as the extension of the “foreign buyer ban” courtesy of the federal government, and you’ve got a recipe for many investors wanting to exit (or not even enter) the market.
And pair all of that with the tariff nonsense bubbling up south of the border, and I think you’ve probably got a reasonable explanation of what’s keeping sales subdued so far this year.
But again, in my view, the tariff nonsense is probably just bit player among a cast of megatrend heavyweights.
For now, anyway.
Glass half full
But, as I’ve been saying to anyone willing to listen over the past few weeks, there’s a silver lining to all of this if you’re a buyer.
Although the Bank of Canada hit pause on another rate cut this April, it remains a fact that mortgage rates are down significantly from their peak in September of 2023.
Buyers shopping for a mortgage today can likely find a five-year fixed rate with a three in front of it, as opposed to the five or six they’d have to entertain only a few short years ago.
On the pricing side, home prices have eased across most segments, with the composite HPI for Vancouver down almost 5.5 per cent from the peak in April of 2022.
Finally, on the inventory side, all of these willing sellers are serving up opportunity on a platter for buyers willing to enter the fray.
Presently, there are nearly 15,000 listings on the MLS® for all GVR areas, which is roughly up a whopping 160 per cent from the recent historic low we saw in 2021.
It’s a market made for buyers if there ever was one.
The question that remains is: when will they return?
Footnotes
Which is an ironic thing to ponder given that just a few years ago, I wrote a post wondering where all the sellers were!↩︎
Fun fact: In BC, approximately 43 per cent of homeowners own their primary residence outright.↩︎
These data from the Canadian Housing Statistics Program (CHSP) stop at 2021, unfortunately.↩︎
Though CREA notes: “While the largest of these declines have been seen in Ontario and British Columbia” … “there are still many regions where sales are high, inventory is near record lows, and prices are rising”.↩︎
Which thankfully I don’t.↩︎